Deploying a Stand-Alone Application
In this chapter, we will learn how to deploy an application using the Dashboard (Kubernetes WebUI) and the Command Line Interface (CLI). We will also expose the application with a NodePort type Service, and access it from outside the Minikube cluster.
Deploying an Application Using the Dashboard
- Let’s learn how to deploy an
nginxwebserver using thenginxDocker container image. - Start
Minikubeand verify that it is running. Run this command first:
$ minikube start
- Then verify Minikube status:
$ minikube status
minikube
type: Control Plane
host: Running
kubelet: Running
apiserver: Running
kubeconfig: Configured
- Start the Minikube Dashboard. To access the Kubernetes Web IU, we need to run the following command:
$ minikube dashboard
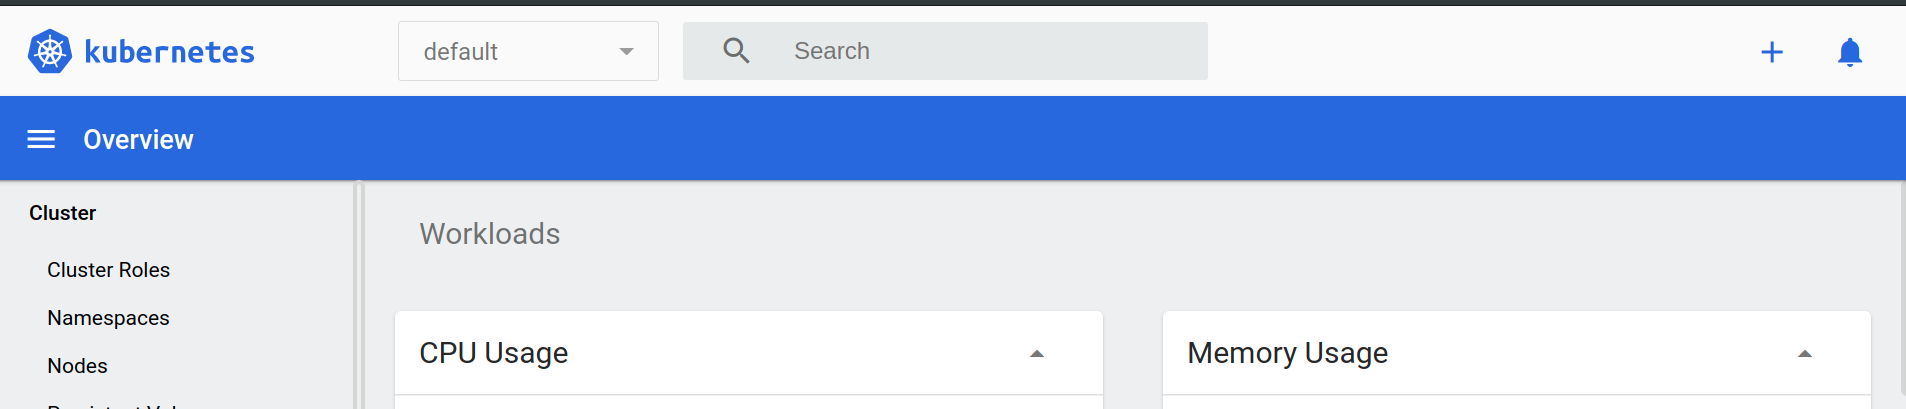
- Running this command will open up a browser with the Kubernetes Web UI, which we can use to manage containerized applications.
- By default, the dashboard is connected to the default Namespace. So, all the operations that we will do in this chapter will be performed inside the default Namespace.
-
NOTE: In case the browser is not opening another tab and does not display the Dashboard as expected, verify the output in your terminal as it may display a link for the Dashboard (together with some Error messages). Copy and paste that link in a new tab of your browser. Depending on your terminal’s features you may be able to just click or right-click the link to open directly in the browser.
-
The link may look similar to: http://127.0.0.1:40235/api/v1/namespaces/kubernetes-dashboard/services/http:kubernetes-dashboard:/proxy/
-
Chances are that the only difference is the PORT number, which above is 40235. Your port number may be different.
-
After a logout/login or a reboot of your workstation the expected behavior may be observed (where the minikube dashboard command directly opens a new tab in your browser displaying the Dashboard).
-
Deploy a webserver using the
nginximage. From the dashboard, click on the "+" sign at the top right corner of the Dashboard. That will open the create interface as seen below:
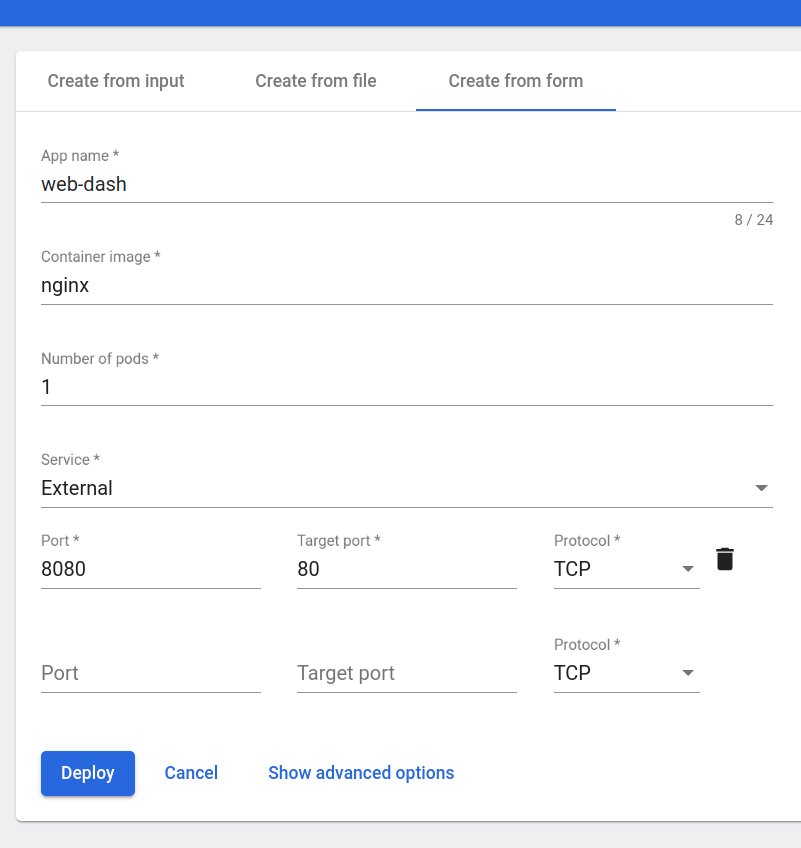
- From there, we can create an application using a valid YAML/JSON configuration data, from a file, or manually from the Create from form tab. Click on the Create from form tab and provide the following application details:
- The application name is web-dash.
- The Docker image to use is nginx.
- The replica count, or the number of Pods, is 1.
- Service is External, Port 8080, Target port 80, Protocol TCP.
-
If we click on Show Advanced Options, we can specify options such as Labels, Namespace, etc. By default, the
appLabel is set to theapplication name. -
In our example
k8s-app:web-dashLabel is set to all objects created by this Deployment: Pods and Services (when exposed). -
By clicking on the Deploy button, we trigger the deployment.
-
As expected, the Deployment
web-dashwill create a ReplicaSet (web-dash-yyyyyyy), which will eventually create 1 Pod (web-dash-xxxxxxxxxxxx). -
NOTE: Add the full URL in the Container Image field
docker.io/library/nginxif any issues are encountered with the simplenginximage name (or use thek8s.gcr.io/nginxURL if it works instead). -
Once we created the web-dash Deployment, we can use the resource navigation panel from the left side of the Dashboard to display details of Deployments, ReplicaSets, and Pods in the default Namespace. The resources displayed by the Dashboard match one-to-one resources displayed from the CLI via kubectl.
-
List the Deployments. We can list all the Deployments in the default Namespace using the kubectl get deployments command:
$ kubectl get deployments

NAME        READY   UP-TO-DATE   AVAILABLE   AGE
web-dash    1/1     1- 1           9m
- List the ReplicaSets. We can list all the ReplicaSets in the default Namespace using the kubectl get replicasets command:
$ kubectl get replicasets

NAME-        DESIRED   CURRENT   READY   AGE
web-dash-74d8bd488f    1         1         1       9m
- List the Pods. We can list all the Pods in the default namespace using the kubectl get pods command:
$ kubectl get pods

NAME- -   READY   STATUS    RESTARTS   AGE
web-dash-74d8bd488f-dwbzz     1/1     Running   0          9m
Exploring Labels and Selectors
- Earlier, we have seen that labels and selectors play an important role in logically grouping a subset of objects to perform operations. Let’s take a closer look at them.
- Look at a Pod’s details. We can look at an object’s details using kubectl describe command. In the following example, you can see a Pod’s description:
$ kubectl describe pod web-dash-74d8bd488f-dwbzz

Name:           web-dash-74d8bd488f-dwbzz
Namespace:      default
Priority:       0
Node:           minikube/192.168.99.100
Start Time:     Mon, 4 Apr 2022 13:17:33 -0500
Labels:         k8s-app=web-dash
-     pod-template-hash=74d8bd488f
Annotations:    <none>
Status:         Running
IP:-  172.17.0.5
Controlled By:  ReplicaSet/web-dash-74d8bd488f
Containers:
  webserver:
    Container ID:   docker://96302d70903fe3b45d5ff3745a706d67d77411c5378f1f293a4bd721896d6420
    Image:          nginx
    Image ID:       docker-pullable://nginx@sha256:8d5341da24ccbdd195a82f2b57968ef5f95bc27b3c3691ace0c7d0acf5612edd
    Port:           <none>
    State:          Running
      Started:      Mon, 4 Apr 2022 13:17:33 -0500
    Ready:          True
    Restart Count:  0
...
- The kubectl describe command displays many more details of a Pod. For now, however, we will focus on the Labels field, where we have a Label set to k8s-app=web-dash.
- List the Pods, along with their attached Labels. With the -L option to the kubectl get pods command, we add extra columns in the output to list Pods with their attached Label keys and their values. In the following example, we are listing Pods with the Label keys k8s-app and label2:
$ kubectl get pods -L k8s-app,label2

NAME- -  READY   STATUS    RESTARTS   AGE   K8S-APP     LABEL2
web-dash-74d8bd488f-dwbzz    1/1     Running   0          14m   web-dash
- All of the Pods are listed, as each Pod has the Label key k8s-app with value set to web-dash. We can see that in the K8S-APP column. As none of the Pods have the label2 Label key, no values are listed under the LABEL2 column.
- Select the Pods with a given Label. To use a selector with the kubectl get pods command, we can use the -l option. In the following example, we are selecting all the Pods that have the k8s-app Label key set to value web-dash:
$ kubectl get pods -l k8s-app=web-dash

NAME- -  READY     STATUS    RESTARTS   AGE
web-dash-74d8bd488f-dwbzz    1/1       Running   0          17m
- In the example above, we listed all the Pods we created, as all of them have the k8s-app Label key set to value web-dash.
- Try using k8s-app=webserver as the Selector:
$ kubectl get pods -l k8s-app=webserver

No resources found.
- As expected, no Pods are listed.
Deploying an Application Using the CLI
- To deploy an application using the CLI, let’s first delete the Deployment we created earlier.
- Delete the Deployment we created earlier. We can delete any object using the kubectl delete command. Next, we are deleting the web-dash Deployment we created earlier with the Dashboard:
$ kubectl delete deployments web-dash

deployment.apps "web-dash" deleted
- Deleting a Deployment also deletes the ReplicaSet and the Pods it created:
$ kubectl get replicasets

No resources found.
$ kubectl get pods

No resources found.
- Create a YAML definition manifest for a Deployment controller. Let’s create the webserver.yaml file with the following content:
apiVersion: apps/v1
kind: Deployment
metadata:
  name: webserver
  labels:
    app: nginx
spec:
  replicas: 3
  selector:
    matchLabels:
      app: nginx
  template:
    metadata:
      labels:
        app: nginx
    spec:
      containers:
      - name: nginx
        image: nginx:alpine
        ports:
        - containerPort: 80
- Using kubectl, we will create the Deployment from the YAML configuration file. Using the -f option with the kubectl create command, we can pass a YAML file as an object’s specification, or a URL to a configuration file from the web. In the following example, we are creating a webserver Deployment:
$ kubectl create -f webserver.yaml

deployment.apps/webserver created
- This will also create a ReplicaSet and Pods, as defined in the YAML configuration file.
$  kubectl get replicasets

NAME-       DESIRED   CURRENT   READY     AGE
webserver-b477df957   3         3         3         45s
$ kubectl get pods

NAME- - READY     STATUS    RESTARTS   AGE
webserver-b477df957-7lnw6   1/1       Running   0          2m
webserver-b477df957-j69q2   1/1       Running   0          2m
webserver-b477df957-xvdkf   1/1       Running   0          2m
Exposing an Application
- In a previous chapter, we explored different ServiceTypes. With ServiceTypes we can define the access method for a Service. For a NodePort ServiceType, Kubernetes opens up a static port on all the worker nodes.
- If we connect to that port from any node, we are proxied to the ClusterIP of the Service. Next, let’s use the NodePort ServiceType while creating a Service.
- Create a
webserver-svc.yamlfile with the following content:
apiVersion: v1
kind: Service
metadata:
  name: web-service
  labels:
    app: nginx
spec:
  type: NodePort
  ports:
  - port: 80
    protocol: TCP
  selector:
    app: nginx
- Using kubectl, create the Service:
$ kubectl create -f webserver-svc.yaml

service/web-service created
- A more direct method of creating a Service is by exposing the previously created Deployment (this method requires an existing Deployment).
- Expose a Deployment with the kubectl expose command:
$ kubectl expose deployment webserver --name=web-service --type=NodePort

service/web-service exposed
- List the Services:
$ kubectl get services

NAME          TYPE        CLUSTER-IP     EXTERNAL-IP   PORT(S)        AGE
kubernetes    ClusterIP   10.96.0.1      <none>        443/TCP        1d
web-service   NodePort    10.110.47.84   <none>        80:31074/TCP   22s
- Our
web-serviceis now created and its ClusterIP is10.110.47.84. - In the PORT(S)section, we see a mapping of
80:31074, which means that we have reserved a static port31074on the node. If we connect to the node on that port, our requests will be proxied to the ClusterIP on port80. - It is not necessary to create the Deployment first, and the Service after. They can be created in any order.
- A Service will find and connect Pods based on the Selector.
- To get more details about the Service, we can use the kubectl describe command, as in the following example:
$ kubectl describe service web-service

Name:-          web-service
Namespace:-     default
Labels:-        app=nginx
Annotations:-   <none>
Selector:-      app=nginx
Type:-          NodePort
IP:-- 10.110.47.84
Port:-          <unset>  80/TCP
TargetPort:-    80/TCP
NodePort:-      <unset>  31074/TCP
Endpoints:-     172.17.0.4:80,172.17.0.5:80,172.17.0.6:80
Session Affinity:         None
External Traffic Policy:  Cluster
Events:-        <none>
web-serviceusesapp=nginxas a Selector to logically group our three Pods, which are listed as endpoints. When a request reaches our Service, it will be served by one of the Pods listed in the Endpoints section.
Accessing an Application
- Our application is running on the Minikube VM node. To access the application from our workstation, let’s first get the IP address of the Minikube VM:
$ minikube ip

192.168.99.100
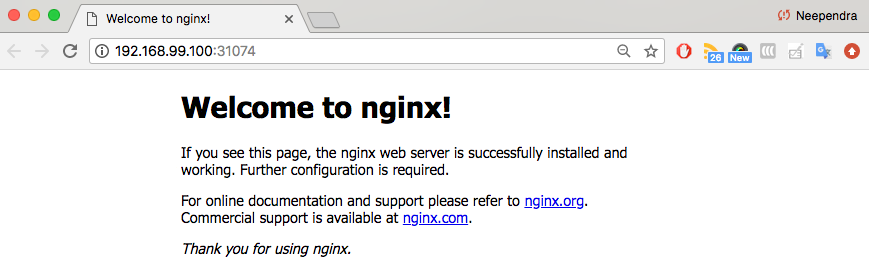
- Now, open the browser and access the application on 192.168.99.100 at port 31074:
- We could also run the following minikube command which displays the application in our browser:
$ minikube service web-service

Opening kubernetes service default/web-service in default browser...
- We can see the Nginx welcome page, displayed by the webserver application running inside the Pods created. Our requests could be served by either one of the three endpoints logically grouped by the Service since the Service acts as a Load Balancer in front of its endpoints.
Liveness and Readiness Probes
- While containerized applications are scheduled to run in pods on nodes across our cluster, at times the applications may become unresponsive or may be delayed during startup.
- Implementing Liveness and Readiness Probes allows the kubelet to control the health of the application running inside a Pod’s container and force a container restart of an unresponsive application.
- When defining both Readiness and Liveness Probes, it is recommended to allow enough time for the Readiness Probe to possibly fail a few times before a pass, and only then check the Liveness Probe.
- If Readiness and Liveness Probes overlap there may be a risk that the container never reaches ready state, being stuck in an infinite re-create - fail loop.
- In the next few sections, we will discuss them in more detail.
Liveness
- If a container in the Pod has been running successfully for a while, but the application running inside this container suddenly stopped responding to our requests, then that container is no longer useful to us.
- This kind of situation can occur, for example, due to application deadlock or memory pressure. In such a case, it is recommended to restart the container to make the application available.
- Rather than restarting it manually, we can use a Liveness Probe. Liveness Probe checks on an application’s health, and if the health check fails, kubelet restarts the affected container automatically.
- Liveness Probes can be set by defining:
- Liveness command
- Liveness HTTP request
- TCP Liveness probe.
Liveness Command
- In the following example, the liveness command is checking the existence of a file
/tmp/healthy:
apiVersion: v1
kind: Pod
metadata:
  labels:
    test: liveness
  name: liveness-exec
spec:
  containers:
  - name: liveness
    image: k8s.gcr.io/busybox
    args:
    - /bin/sh
    - -c
    - touch /tmp/healthy; sleep 30; rm -rf /tmp/healthy; sleep 600
    livenessProbe:
      exec:
        command:
        - cat
        - /tmp/healthy
      initialDelaySeconds: 3
      failureThreshold: 1
      periodSeconds: 5
- The existence of the
/tmp/healthyfile is configured to be checked every 5 seconds using theperiodSecondsparameter. - The
initialDelaySecondsparameter requests thekubeletto wait for3 secondsbefore the first probe. - When running the command line argument to the container, we will first create the
/tmp/healthyfile, and then we will remove it after 30 seconds. - The removal of the file would trigger a probe failure, while the
failureThresholdparameter set to1instructskubeletto declare the container unhealthy after a single probe failure and trigger a container restart as a result. - A demonstration video covering this method is up next.
Liveness Command (Demo)
Liveness HTTP Request
- In the following example, the
kubeletsends the HTTP GET request to the/healthzendpoint of the application, on port8080. - If that returns a failure, then the kubelet will restart the affected container; otherwise, it would consider the application to be alive:
     livenessProbe:
       httpGet:
         path: /healthz
         port: 8080
         httpHeaders:
         - name: X-Custom-Header
           value: Awesome
       initialDelaySeconds: 3
       periodSeconds: 3
TCP Liveness Probe
- With TCP Liveness Probe, the kubelet attempts to open the TCP Socket to the container which is running the application.
- If it succeeds, the application is considered healthy, otherwise the kubelet would mark it as unhealthy and restart the affected container.
    livenessProbe:
      tcpSocket:
        port: 8080
      initialDelaySeconds: 15
      periodSeconds: 20
Readiness Probes
- Sometimes, while initializing, applications have to meet certain conditions before they become ready to serve traffic.
- These conditions include ensuring that the depending service is ready, or acknowledging that a large dataset needs to be loaded, etc.
- In such cases, we use Readiness Probes and wait for a certain condition to occur. Only then, the application can serve traffic.
- A Pod with containers that do not report ready status will not receive traffic from Kubernetes Services.
    readinessProbe:
          exec:
- command:
- - cat
- - /tmp/healthy
          initialDelaySeconds: 5
          periodSeconds: 5
- Readiness Probes are configured similarly to Liveness Probes. Their configuration also remains the same.
Deploying a Containerized Application (Demo)
Learning Objectives (Review)
By the end of this chapter, you should be able to:
- Deploy an application from the dashboard.
- Deploy an application from a
YAMLfile usingkubectl. - Expose a service using
NodePort. - Access the application from outside the
Minikubecluster.